See also
- @graphviz in the Ruffus Manual
- Decorators for more decorators
graphviz
@graphviz ( graphviz_parameters,...] )
Contributed by Sean Davis, with improved syntax via Jake Biesinger
- Purpose:
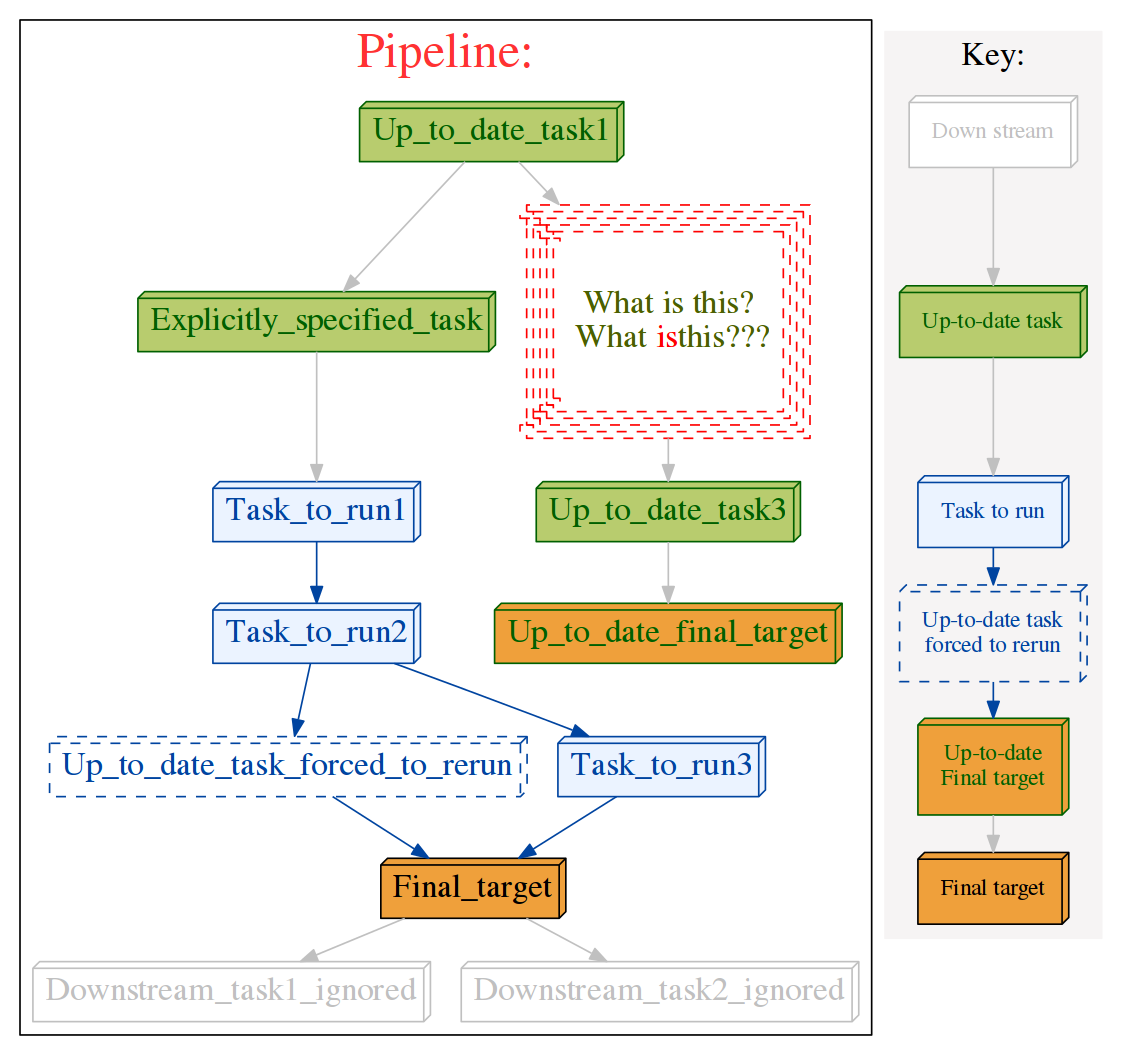
Customise the graphic for each task in printed flowcharts by adding graphviz attributes, (URL, shape, colour) to that node.
This allows HTML formatting in the task names (using the
labelparameter as in the following example). HTML labels must be enclosed in<and>. E.g.label = "<Line <BR/> wrapped task_name()>"You can also opt to keep the task name and wrap it with a prefix and suffix:
label_suffix = "??? ", label_prefix = ": What is this?"The
URLattribute allows the generation of clickable svg, and also client / server side image maps usable in web pages. See Graphviz documentation- Example:
Parameters:
named graphviz_parameters
Including among others:
- URL (e.g.
"www.ruffus.org.uk")- fillcolor
- color
- pencolor
- fontcolor
- label_suffix (appended to task name)
- label_prefix (precedes task name)
- label (replaces task name)
- shape (e.g.
"component", "box", "diamond", "doubleoctagon"etc., see graphviz )- height
- peripheries (Number of borders)
- style (e.g.
"solid", "wedged", "dashed"etc., see graphviz )Colours may specified as
'"#FFCCCC"', 'red', 'red:blue', '/bugn9/7'etc. see color names and colour schemes